River Avenue Blues

  • About
    • Privacy Policy
  • Features
    • Yankees Top 30 Prospects
    • Prospect Profiles
    • Fan Confidence
  • Resources
    • 2019 Draft Order
    • Depth Chart
    • Bullpen Workload
    • Guide to Stats
  • Shop and Tickets
    • RAB Tickets
    • MLB Shop
    • Fanatics
    • Amazon
    • Steiner Sports Memorabilia
River Ave. Blues » Archives for Larry Koestler » Page 9

Dispelling the RISP Fail myth

November 11, 2011 by Larry Koestler 25 Comments

Ah, RISP Fail, a phenomenon that really gained traction — merited or not — during the 2010 season. Last year’s team posted a .267/.357/.441 line with runners on, good for a 103 tOPS+, and 12% better than league average (112 sOPS+); and a .258/.363/.420 line with runners in scoring position, which was essentially exactly how they hit in all other situations (100 tOPS+), and a mark 9% better than league average.

While those full-season numbers with runners on and RISP are plenty respectable, the RISP Fail meme grew to apocalyptic proportions during the 2010 season’s final month, as the team hit just .225/.350/.331 (.681 OPS) in 338 September plate appearances with runners in scoring position. Coupled with an anemic offensive performance against Texas in the 2010 ALCS, and the team’s seeming futility with runners in scoring position became an easy scapegoat for the team’s shortcomings.

So was there any truth to this perception? Below are two charts showing the team’s numbers with runners on and with runners in scoring position going back to 2007. As an aside, the reason I’ve chosen 2007 as the cutoff for the majority of the historical team-wide comparisons I’ve been doing thus far is because several seasons worth of data helps detect patterns and/or trends, but going back any further than five years will likely make any conclusions less meaningful given that the composition of both the team and the league was quite a bit different. Even going back to 2007 doesn’t really tell you anything about the 2011 team, but simply showing the 2010 and 2011 numbers paints a fairly limited picture.

Anyway. (click to enlarge)

It turns out the one year fans may have actually had a legitimate gripe regarding the team plating baserunners was 2008, the only season of these five they were below-league average both with runners on and runners in scoring position. Though the 2010 season did end up coming in as the second-lowest of the five in terms of sOPS+, lending perhaps some credence to the frustration with the team’s periodic inability to hit with RISP, at least in comparison to how Yankee teams of recent vintage fared.

Fortunately the 2011 team put the 2010 Yankees to shame when it came to hitting with both men on and runners in scoring position, posting five-year highs in both tOPS+ and sOPS+ in both splits. In fact, they were the second-best hitting team with runners on and the best-hitting team with runners in scoring position compared to the league in 2011:

Men on AVG OBP SLG tOPS+ sOPS+
BOS .294 .364 .474 107 127
NYY .270 .349 .465 106 120
DET .288 .349 .444 105 115
TEX .277 .335 .438 94 110
BAL .266 .329 .432 109 106
CLE .271 .345 .412 113 106
KCR .277 .330 .419 101 103
CHW .259 .333 .401 108 100
TBR .242 .326 .406 102 99
TOR .248 .324 .406 100 98
LAA .252 .316 .406 102 96
OAK .254 .321 .376 105 90
MIN .253 .317 .360 104 85
SEA .241 .307 .357 108 81


RISP AVG OBP SLG tOPS+ sOPS+
NYY .273 .361 .455 108 122
BOS .278 .359 .452 101 121
TEX .285 .354 .450 102 119
DET .280 .350 .426 101 112
CLE .269 .354 .409 115 108
KCR .276 .333 .426 104 107
BAL .263 .332 .416 106 104
OAK .266 .340 .399 118 102
LAA .255 .334 .405 108 102
TOR .237 .331 .387 98 96
CHW .239 .324 .373 98 90
TBR .224 .322 .371 92 89
MIN .248 .319 .354 103 84
SEA .222 .306 .325 98 73

Interestingly, Cleveland of all teams really turned things on when they had runners on, compared to the way they hit in all situations, with an AL-high 113 tOPS+ with men on, and a second-best-in-the-league 115 tOPS+ with runners in scoring position. Strangely enough, Oakland led the league in tOPS+ with RISP, hitting 18% better than usual in these situations, though given their overall season line of .244/.311/.369 that’s still not saying much.

Also, next time you’re concerned about the Yankees’ hitting with RISP, just be glad you’re not a Mariners fan. The folks in Seattle must be among the most patient in the world; I’m not sure how you follow a baseball team that not only put up a .233/.292/.348 line over 162 games, but actually managed to hit 2% worse than that with runners in scoring position.

Filed Under: Analysis Tagged With: RISP Fail

Should the Yankees look at Rich Harden as back-of-the-rotation fodder?

November 9, 2011 by Larry Koestler 45 Comments

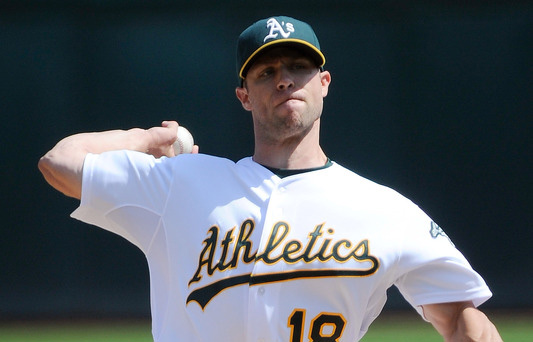
(Photo by Thearon W. Henderson/Getty Images)

On Tuesday Mike took a look at the A’s starters that are still under contract that could theoretically be acquired via trade. Today I wanted to look at a righty who pitched for the A’s last season that could be acquired for just money: free agent Rich Harden.

Before we dive too deeply into this, note that a potential Yankee acquisition of Harden almost certainly wouldn’t occur until January, comes with the assumption that they don’t end up signing either Yu Darvish or C.J. Wilson, and that the team would likely be looking at the oft-injured Harden as the 2012 version of either Freddy Garcia or Bartolo Colon.

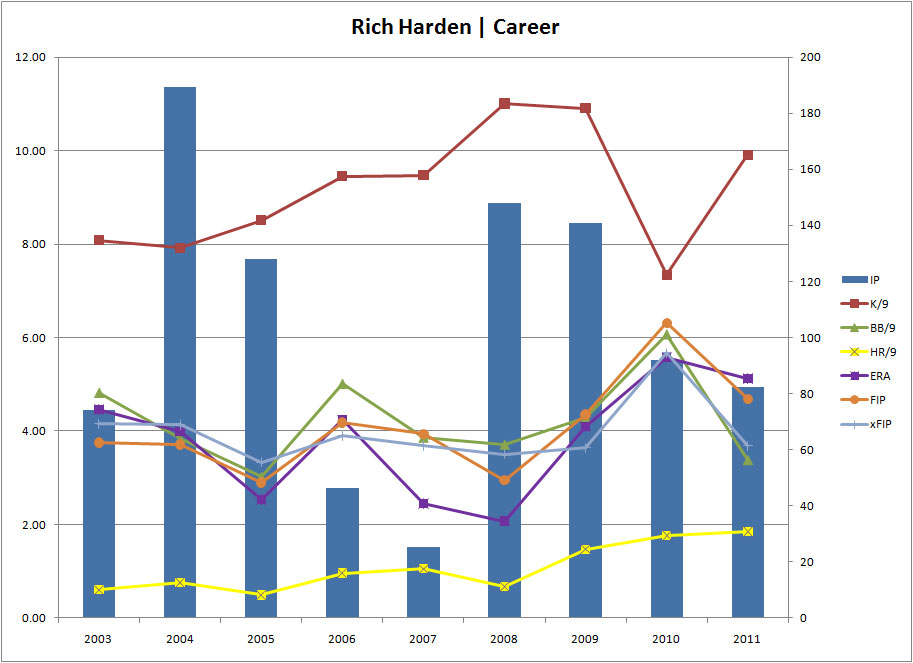
Anyway, it wasn’t too long ago that Harden was one of the best pitchers on the planet. Starting with his inaugural season through the end of 2009, Harden compiled the 9th-best ERA (3.39) in all of MLB among pitchers with 750-plus innings. Among that same group he posted the top K/9 in all of baseball (9.35) and 15th-best FIP (3.58).

Unfortunately, while the soon-to-be 31-year-old Harden has frequently been brilliant, he has of course also frequently been injured. He’s never thrown more than 200 innings in a season, and has only even broken the 150-inning plateau once, back in 2004 (a career-high 189.2 innings and 31 starts). Harden’s litany of professional injuries began in 2005, as he lost more than a month to an oblique strain, and suffered a shoulder injury later in the year. The 2006 and 2007 seasons were almost entirely lost to injury, as he made a combined 13 starts in between recovering from a series of back, elbow and shoulder problems.

Harden got semi-back on track in 2008, turning in a superb 13 starts for the Athletics (2.34 ERA/2.83 FIP) before  being traded to the Cubs and compiling an even better 12 starts for Chicago (1.70 ERA/3.08 FIP) in the stretch run, though he still missed time with another right shoulder injury. The Cubs picked up Harden’s option for 2009, but still another back injury and right arm injury limited his effectiveness, and he turned in the worst full season of his career.

The Rangers ended up signing Harden in December 2009 to what seemed to be an aggressive one-year, $7.5 million deal. I was beating the drum pretty hard for Ben Sheets at the time — whose career rather eerily mirrors Harden’s — as both pitchers looked to be solid high-risk, high-reward signings. Harden wound up being terrible for Texas in yet another injury-plagued year, and was released after the season.

The A’s signed him to a one-year deal last winter, and though he (surprise, surprise) started the year on the DL with yet another shoulder injury, he threw fairly well over his first nine starts of the season, tossing to a 3.91 ERA and a crazy 10.2 K/9, showing that he still had his famous strikeout stuff despite a significant decline in velocity from his peak fastball. Unfortunately for Harden, the Yankees more or less broke him during the three-grand slam game, and he finished the season tossing to a 7.28 ERA over his final six starts.

So what does the enigmatic Harden have to offer potential suitors? I initially created a table breaking down his repertoire and results against righties and lefties over the last few seasons, courtesy of TexasLeaguers.com, but rather than post that monstrosity here I’ll just summarize.

Here’s the good news: all four of Harden’s pitches — the low-90s four-seamer, low-80s slider, low-80s changeup and low-80s splitter, were above-average Whiff% pitches against hitters from both sides of the plate. The changeup in particular wreaked havoc on righties, racking up a 30.8% whiff rate (compared to 12.6% league average). As a point of comparison, James Shields’s Whiff% with the change against righties was 20.5%. Now, Shields of course deployed the changeup quite a bit more frequently than Harden, but it’s still a point in Harden’s favor. Harden’s change has also been a valuable weapon against lefties, with a 20.5% Whiff%.

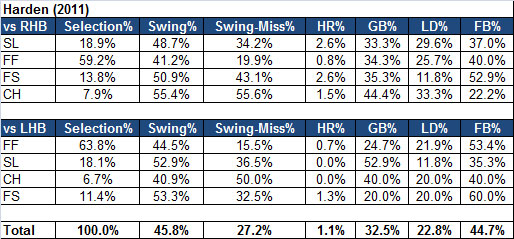
Here’s the not-so-good news (batted ball data from JoeLefkowitz.com):

While the slider was a strong swing-and-miss offering against righties, they also punished his apparently fairly frequent mistakes, as 2.6% of his sliders left the yard. In fact, Harden gave up a career-high 1.85 home runs per nine in 2011. The remainder of his batted-ball profile is a bit scary as well, with a 22.8% LD% that would’ve put him among the highest in baseball had he enough innings to qualify (though CC Sabathia finished in the top 10, so it’s not as if that’s some automatic death knell), while his GB% would have been among the lowest in the league.

Still, Harden finished the season with a 9.91 K/9, which is bound to draw interest from a number of different parties, even with his myriad injury issues. Even though he hasn’t been an elite pitcher since 2008, I would be surprised if Harden was still on the market by the time the Yankees would theoretically come calling.

That said, if he is still hanging around come January, and the Yankees still have an opening in the rotation, if I’m the Yanks I would absolutely take a flier on Harden, who they were looking at as a potential waiver-wire acquisition in August, and who probably isn’t in line for all that much more than the $1.5 million he picked up with the A’s last season.

Filed Under: Hot Stove League Tagged With: Rich Harden

The Yankees’ ever-so-slight decline against righthanded pitching

November 7, 2011 by Larry Koestler 32 Comments

The Yankees were, once again, a superb offensive team in 2011. It can be easy to take the team’s offense for granted considering how good Yankee fans have had it over the last decade. To wit (MLB rank in parentheses):

wOBA wRC+
2011 .346 (3) 113 (2)
2010 .347 (1) 112 (1)
2009 .366 (1) 117 (1)
2008 .338 (6) 104 (6)
2007 .362 (1) 120 (1)
2006 .358 (1) 115 (1)
2005 .350 (2) 116 (1)
2004 .350 (2) 113 (2)
2003 .352 (3) 115 (2)
2002 .352 (1) 116 (1)

This table is absurd. The Yankees have been the best offensive team in all of baseball in terms of wOBA in five of the past 10 seasons, and after adjusting for park and league they come out on top in six of the past 10 years. Those numbers appeared poised to rise to six and seven years, respectively, as they led the AL in both wOBA and wRC+ as late as August 23, but a quiet offensive September combined with a lightning-hot Texas offense saw the team fall to third overall by season’s end. Still, in the few years they didn’t field the very best offense in baseball, they finished in the top three every season save one — 2008, when they finished 6th.

So yes, clearly we Yankee fans have been spoiled on the offensive front. I consider myself a pretty reasonable fan regarding most aspects of the game, although given the team’s embarrassment of offensive riches the one area in which I do occasionally veer into irrational territory is when they do things like get shutdown by Jeremy Guthrie. But that’s just me.

The point of this preamble is to acknowledge that trying to poke holes in the Yankees’ robust offensive attack is nit-picking at its best, but being the offseason and all I still find it interesting to compare and contrast how the team fared in a variety of splits. In the case of facing right-handed pitching — and especially in the aftermath of the Yankees’ ALDS loss to the Tigers, in which they saw zero left-handed starters — I thought it might useful to try to find out why the 2011 Yankees posted the team’s worst numbers against RHP in the last five seasons.

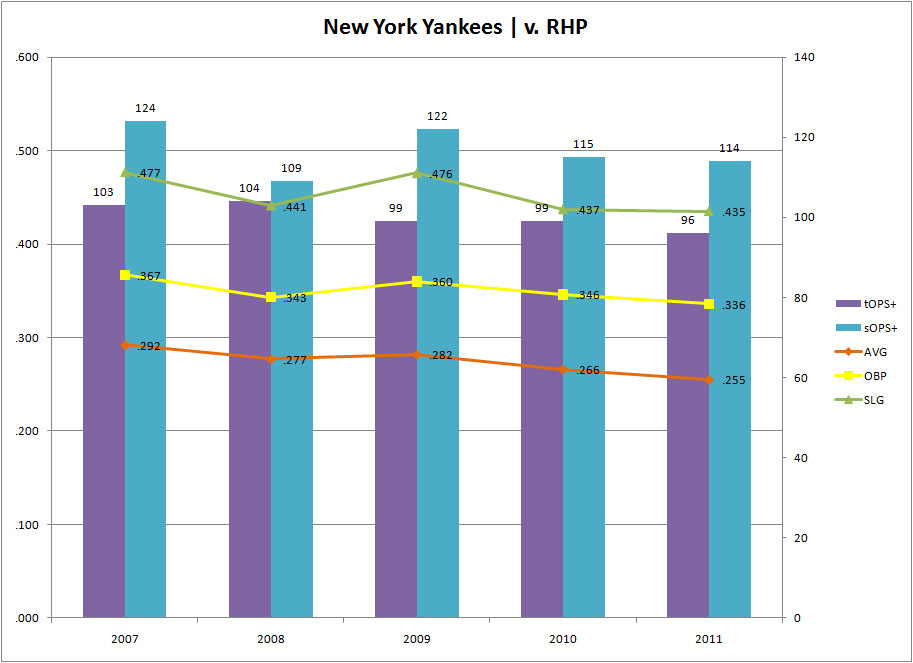
(click to enlarge)

As you can see in the above chart, the 2007 and 2009 teams annihilated right-handed pitching, outhitting the league by 24% and 22%, respectively. The RHP decline began in 2010, and continued into 2011, as the team posted five-year lows in all three triple-slash categories vs. RHP as well as sOPS+.

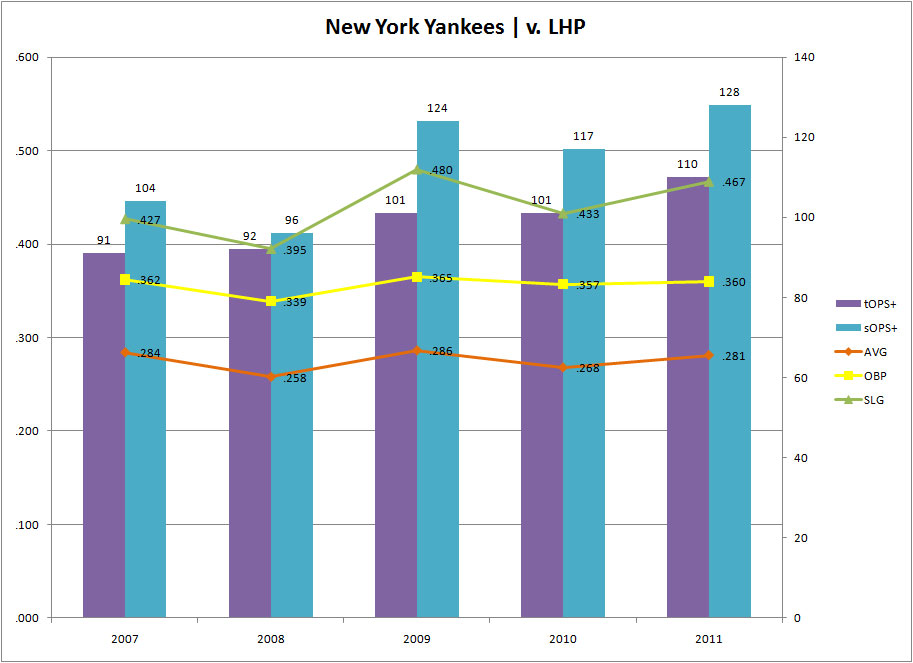
They did continue to outhit the league, this time by 14%, so it’s not as if they were anemic vs. right-handers, but the platoon split is quite a bit more dramatic when you look at how they’ve fared against left-handers of recent vintage:

The Yankees utterly destroyed left-handed pitching in 2011, leading the Majors in both OBP and SLG vs. portsiders, and posting five-year highs in both sOPS+ and tOPS+, outhitting the league by a whopping 28%.

Culprit #1: The Offense

So why the slight drop-off against righties? Perusing the lineup’s splits, it’s not too hard to see why, as Mark Teixeira put up a .337 wOBA against northpaws (including a meager .323 OBP), Nick Swisher a .335 mark, Brett Gardner a .328 and Derek Jeter a .298 wOBA, though in fairness, Tex, Swish and Gardner were all above league average. Still, given that Tex and Swish are going to get the majority of their PAs against RHP, they have to be better than ~108 wRC+ players. Swish seems a decent-enough bet to bounce back, and he’s only a year removed from putting up a 132 wRC+ against righties.

I’m a little less sure about Tex, who’s on a three-year decline against righties, and, as the entire Yankosphere has noted in every way, shape or form, has to figure out how to fix his woes from the left side of the plate. Being that Gardner’s bat is invisible against lefties (75 wRC+), you’d ideally like him to be a bit better than average (101 wRC+) against righties, but I suppose you take what you can get from Brett. As for Derek, while it didn’t really end up negatively affecting the team — especially after his second-half renaissance — if Derek continues to struggle against righties the Yankees may actually be hurting themselves if Girardi refuses to move Jeter out of the one-hole against right-handed pitchers, as .277/.329/.338 is pretty much the exact opposite of what you want out of your leadoff hitter.

Culprit #2: Opposing Pitching

For as much as certain members of the offense are culpable, we also do need to give some credit to the pitchers the team faced. The Yankees had 4,434 plate appearances against right-handed pitching in 2011. Josh Beckett accounted for 136 of those, and threw 34 innings of 1.85 ERA ball against the Yanks. The Yankees had 150 PAs against James Shields, who pitched to a 2.33 ERA against the Yanks over 38.2 innings. Brandon Morrow faced 80 Yankees, and threw to a 1.74 ERA over 20.2 innings. Jered Weaver and Dan Haren combined for 113 PAs against the Yankees, with the former throwing 15 innings of 1.80 ball and the latter 15 2/3 innings of 2.30 ball. Heck, R.A. Dickey’s 1.64 was the lowest ERA against the Yankees (min. 2 starts) in 2011, and he accounted for 46 PAs. And of course, the enigmatic Phil Humber managed a 2.70 ERA over 13.1 innings and 50 PAs.

Those seven pitchers represented 13% of the Yankees plate appearances against right-handed pitching, and while that’s obviously only a small portion of the overall universe of right-handers faced, that these righties combined for an insane 2.06 ERA over their148.1 collective innings certainly had some impact on the team’s overall numbers against right-handers.

Fun (if highly unlikely) Solutions

Using Baseball Musings’ Lineup Analysis tool, if you plug in the 2011 team’s most-frequently-used versus-right-handers lineup with their vs. right-handed pitching OBPs and SLGs, you get a lineup averaging 5.277 runs per game. If you use the team’s most-oft-used versus-left-handers lineup, and their vs. left-handed pitching splits, you get a lineup averaging an absurd 6.131 runs per game.

Now if we do the same exercise for the 2012 team, swapping Jesus Montero in for Jorge Posada/Andruw Jones, use the Major League Equivalencies for Montero’s 2011 AAA splits (using his actual September 2011 MLB splits isn’t helpful, given how insane his numbers were), and also sort the lineups by highest OBP to lowest, we get the following:

v RHP AVG OBP SLG
Curtis Granderson .258 .372 .531
Alex Rodriguez .276 .361 .487
Robinson Cano .296 .347 .537
Brett Gardner .265 .345 .393
Nick Swisher .232 .343 .420
Derek Jeter .277 .329 .338
Russell Martin .248 .327 .422
Mark Teixeira .223 .323 .450
Jesus Montero .236 .285 .336
v LHP AVG OBP SLG
Nick Swisher .327 .442 .516
Derek Jeter .349 .423 .523
Mark Teixeira .302 .380 .587
Alex Rodriguez .277 .367 .383
Robinson Cano .314 .354 .525
Curtis Granderson .272 .347 .597
Brett Gardner .233 .344 .272
Jesus Montero .282 .339 .532
Russell Martin .211 .316 .368

That above  lineup vs. right-handers would only score 4.958 runs per game, while the “best” version of that lineup would score 5.135 runs per game. However, if you want to swap Montero’s actual AAA split against RHP (.272/.330/.399) you get 5.106 runs per game, with the “best” version — featuring Gardner leading off, followed by Grandy, Swish, Cano, A-Rod, Tex, Martin, Montero and Jeter — at 5.258 runs per game, or basically what the 2011 version did against RHP. That’s actually a pretty reasonable lineup deployment, and if you factor in presumed improved seasons from Tex and Swish I’d expect a superior 2012 team performance against righties.

While the lineup probably doesn’t need any tweaking against southpaws, just for fun, the above lineup vs. left-handers averages an insane 6.002 runs per game, and the “best” iteration comes in at 6.285 R/PG. If you swap in Montero’s actual AAA split against LHP ( .328/.392/.647), you get 6.160 runs per game, with a “best” version pounding out 6.526 runs per game, and featuring Montero at cleanup! If things go as planned, we may actually be closer to experiencing that particular bit of awesomeness than previously thought.

Filed Under: Analysis Tagged With: Splits

An updated look at the Yankees vs. Fangraphs’ five primary pitch types

November 4, 2011 by Larry Koestler 7 Comments

Back on August 16 I took a look at how the Yankees were faring against the five major pitch types captured by FanGraphs compared to the previous four seasons, and with the season over I wanted to follow up to see how the team finished the year out. Of course, there are a couple of caveats: I’ll be the first to admit that given the already wide gulf between the BIS data collection that FanGraphs uses and the PITCHf/x data that powers Brooks, TexasLeaguers.com and JoeLefkowitz.com — not to mention the fact that the latter three sites have their own classification issues — these numbers are not a 100% perfect representation of what occurred.

Another issue I have with FanGraphs’ BIS data is that four-seamers and two-seamers are all binned under one catch-all “Fastball” category, which seems inherently result-skewing given a two-seamer/sinker’s increased likelihood of generating a ground ball over a four-seamer. You also end up with things like Ian Kennedy — no one’s idea of a particularly overpowering fastball-thrower (avg. vel. 90.3 mph) — leading all of MLB with a 28.7 wFB, due in part to the fact that he threw more two-seamers (36.7%) than four-seamers (29.8%), while Justin Verlander — who probably has the best four-seamer in the game — ended up coming in 3rd, at 25.5 runs above average.

So now that I’ve spent 200 words telling you why you should be wary of the numbers, let’s dive right in, shall we? Until someone comes along with a more reliable freely available system that tallies how teams/players fared against specific pitches, these should at least represent a close approximation of accurate pitch type linear weight results.

The 2011 Yankees creamolished fastballs, but you already knew that. Interestingly they only saw a fastball ~56% of the time, which is a five-year low. At the time of the August 16 post they led all of MLB in wFB/C, but in September the team posted their second-worst monthly wOBA out of the last 66 months dating back to the beginning of the 2001 season, enabling the Rangers and Red Sox to slug past them. The Yankees who performed best against the fastball were Jesus Montero, Andruw Jones and Curtis Granderson. The only member of the everyday lineup with negative run values against the fastball was Jorge Posada.

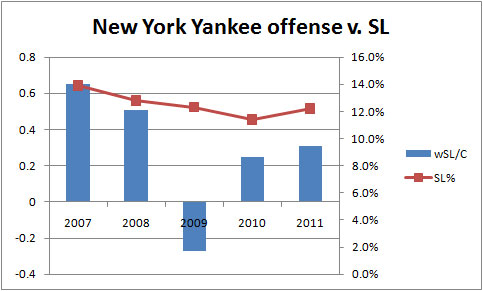
The team hit sliders well for a second-straight year, and this shouldn’t be a surprise, as they generally seemed to fare pretty well against the heavy fastball-slider types (think Alexi Ogando, Juan Nicasio, Felipe Paulino, etc.) they faced during the season. Robinson Cano, Mark Teixeira, and Derek Jeter had the three highest run values against the slider in 2011. Of the lineup regulars, Nick Swisher was the least successful against the slider.

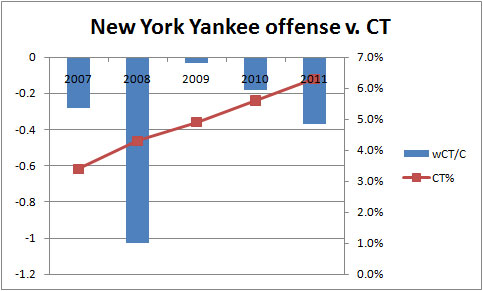
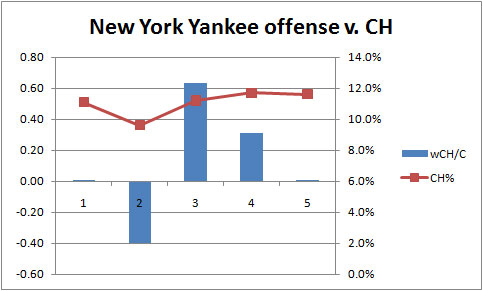
This may be the most surprising chart. The Yankees haven’t posted positive run values against the cutter during any of the last five seasons, and are on a three-year decline against the cut fastball. Unsurprisingly, opponents’ deployment of the cutter is on a five-year increase. I’d imagine that both the decreased effectiveness against and uptick in cutters seen is at least due in part to the fact that the Yankees have to see Jon Lester — who threw the 7th-most cutters in MLB last season and had the 7th-best wCT/C — and Josh Beckett — 16th-most cutters in MLB; 9th-best wCT/C — approximately 8,000 times a season. Also high on the cutters-thrown list are Dan Haren (1st), Gavin Floyd (5th), Josh Tomlin (6th) and John Danks (9th). Despite this cutter issue, Robinson Cano annihilated the pitch, while Posada and Jeter also fared well. As we saw on Wednesday, the cutter has not been kind to Alex Rodriguez of late, and in fact he got positively destroyed by the cutter in 2011, coming in at -3.03 wCT/C — a mark that would have been 7th-worst in baseball had he had enough plate appearances to qualify.

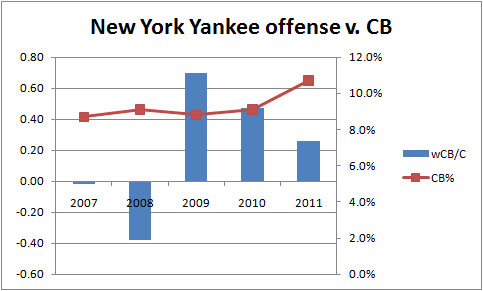
On August 16th the Yankees’ wCB/C was -0.30, but they managed to finish the year at 0.26, representing their biggest improvement of the five pitch types in this post. They also saw a five-year high in curve% this season. Jeter, Nunez and Russell Martin fared best against the curve. Of everyday players, it probably won’t surprise you to learn that Tex (-0.35 wCB/C) was the least effective member of the lineup against the hook.

If you were to poll a swath of Yankee fans and ask “which pitch do the Yankees have the hardest time with?” I’d imagine the changeup would be the most popular answer. Though they posted positive run values against the change in 2009 and 2010, anecdotally it feels like we see them flail away at changeups to no avail quite frequently. That said, my view may be somewhat distorted due to the fact that two of the game’s very-best changeup-throwers — Felix Hernandez and James Shields — have owned the Yankees seemingly forever. Though they did shockingly get to Felix for the first time in eons this September, he and Shields have been the Yankees’ greatest foils these last few seasons. Going back to the beginning of the 2008 season, Felix and Big Game James have the top two lowest ERAs (2.82 and 2.91, respectively) against the Yankees among pitchers who have made a minimum of eight starts against the Bombers. That’s insane. Even crazier is that Shields’ mark is across 15 starts to Felix’s eight. Additionally, Shields pitched to a 2.33 ERA over 38 2/3 innings against the Yankees in 2011, the third-lowest ERA among starters that made at least three starts against the team this year.

Gardner, Cano and Granderson were the team’s most effective everyday players against the change, while Russell Martin, Jorge Posada and Derek Jeter got destroyed by it. Alex Rodriguez also posted negative run values, so basically if you’re a right-handed pitcher with a great changeup, you’ve got three auto-outs when facing the Yankees. Hopefully Kevin Long can do some work with the Yankees’ right-handed bats to help them combat their offspeed difficulties.

Filed Under: Analysis Tagged With: Pitch Type Linear Weights

A-Rod’s continued woes against left-handed pitching

November 2, 2011 by Larry Koestler 14 Comments

(Photo by Nick Laham/Getty Images)

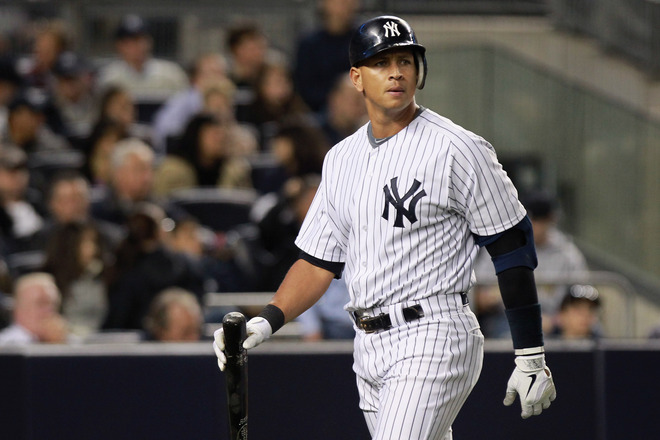
Alex Rodriguez has been an equal opportunity masher for almost the entirety of his career, bashing righties to the tune of a .306/.386/.570 line and crushing lefties with a .289/.386/.559 triple slash. However, something funny happened on the way to Alex’s 2010 campaign — his production against left-handed pitching fell off dramatically, as he put up a meager .217/.314/.441 line (.323 wOBA, 96 wRC+) against lefties across 172 plate appearances.

(please click to enlarge)

Last winter I dug into the numbers to figure out why that might have been, and concluded that Alex’s struggles against lefties appeared to be due in part to an uptick in cutters (7.2% of the time), two-seamers (15.3%) and changeups (16.1%) seen, none of which he handled particularly well last year.

v LHP 2010 GB% LD%
FC 57.1% 14.3%
CH 53.8% 15.4%
FT 41.2% 5.9%
Season (v all) 46.0% 17.8%

(PITCHf/x data courtesy of JoeLefkowitz.com)

My former co-writer at TYA, William J., followed my A-Rod post up with a comprehensive look of his own, and found that Alex’s struggles against lefties likely had something to do with his minuscule .212 BABIP, which probably was partially the result of his LD% against lefties falling from 26.4% in 2009 to 12.1% last season. William also dug a bit deeper and found that 26% of Alex’s plate appearances against lefties came against the AL’s elite southpaws — including David Price, Ricky Romero, Jon Lester and Cliff Lee, among others — and found that his production essentially decreased across the board year-over-year against the league’s best.

So how did Alex follow this (hopefully) one-year aberration in production against left-handed pitching in 2011? Well, for one, he managed to dramatically improve both his batting average and on-base percentage, and also bettered his 2010 wOBA v. lefties with a .333 mark, which actually made him a slightly above-average producer against southpaws (105 wRC+). Some of this was no doubt fueled by a .100-point-plus increase in BABIP against lefties to .316 in 2011 (which itself was the partial result of a rise in LD% back up to 19.2%). However, his ability to hit for power fell off a cliff (though as we saw in the second-half following his return from the DL, this wasn’t an issue exclusive to facing lefties), as he put up a mere .383 SLG against lefties in 2011. In fact, A-Rod only hit two home runs off left-handed starting pitching all season — one against Chris Capuano on May 21, and the other against former-Yankee-killer Brett Cecil on September 4.

Now we do need to acknowledge that there are some sample size issues here, as he only came to the plate 109 times against left-handed pitching in 2011, compared to an average of 168 PAs from 2004-2010. Still, that lack of power is troubling, especially since he showed he can still get on base against left-handed pitchers.

The pitch selection against Alex varied (though it’s important to bear in mind that year-over-year PITCHf/x data is not the most reliable thing in the world, given the myriad misclassification issues that can arise, but as I don’t have time to manually reclassify questionable pitches we have to use the data that’s readily available), with the percentage of cutters and two-seamers down from 2010 (to 4.1% and 11.9%, respectively), which changeups ticked up slightly (17.4%). However, they remained rather effective weapons against Alex, as his batted ball results against these three pitches didn’t exactly improve:

v LHP 2011 GB% LD%
FC 50.0% 16.7%
CH 79.9% 0.0%
FT 75.0% 8.3%
Season (v all) 48.4% 13.2%

As in 2010, a little over a quarter of his PAs against left-handers came against the league’s elite, as he stepped to the plate against Ricky Romero, Jon Lester and David Price 31 times over 7 games, and they continued to crush him, as he picked up a mere three hits against that trio.

Now, in fairness, Alex really didn’t look right after returning from knee surgery in late August — although the majority of his PAs against lefties came prior to his stint on the DL — so I’m willing to give him a slight pass on his late-season performance. Also, as previously acknowledged, this isn’t a perfect comparison, given that Alex’s number of PAs against lefties fell by 36% in 2011. However, I think we have enough of a sample to concur that A-Rod has definitely struggled against left-handers for two straight seasons, with the former seemingly due in part to some bad luck and the latter due to an inability to drive the ball.

It’s difficult to be terribly optimistic about Alex’s chances of a significant bounceback year after two straight injury-riddled ~.360 wOBA campaigns featuring diminished performances against pitchers he should in theory have a platoon advantage against. However, it seems like a 100% healthy A-Rod should be able to outdo a .333 wOBA against portsiders. At this point I suppose the biggest question is whether he can actually stay healthy.

Filed Under: Analysis Tagged With: Alex Rodriguez

Can Phil Hughes be saved?

October 31, 2011 by Larry Koestler 57 Comments

(Photo by Nick Laham/Getty Images)

Last week at TYA I wrote about the plight of Phil Hughes, recapping the right-hander’s many ups and downs (though mostly downs) since debuting in the Major Leagues on April 26, 2007. I’d hazard a guess that many in Yankeeland have just about reached their limit with Hughes, and it seems the general consensus is that the Yankees would be lucky if their formerly prized righty developed into a reliable number three starter. I don’t necessarily disagree, although that’s a pretty big fall from grace for a pitcher who was near-universally regarded as a future number-one starter (if you’re in the mood to weep, have a look at our own Mike Axisa’s prospect profile of Hughes in the pre-RAB days), as he rocketed his way through the Yankees’ minor league system.

Given that last week’s piece was primarily prose-driven and fairly unencumbered by statistics, I wanted to take a deeper dive into the numbers to see whether there was anything noteworthy that might signal that perhaps Hughes hasn’t reached his peak yet.

For the purposes of this post, I’ve divided Hughes’ career into 11 segments dating back to the beginning of the 2008 season (I’d have gone further, except ’08 is the first season we have PITCHf/x data for): (1) his messy April 2008 as a starter; (2) his brief reappearance in September of that season; (3) his stint as a starter in 2009; (4) his stint as a reliever in 2009; (5) his stint as a reliever in the 2009 postseason; (6) the first 12 starts of his dominant first half in 2010; (7) his considerably uglier second-half of 2010; (8) his three starts in the 2010 postseason; (9) his three terrible starts at the beginning of 2011; (10) his improved second-half as a starter in 2011; and (11) his final four appearances of 2011 as a reliever.

I’m also taking a look at the three main pitches Hughes has thrown the most over his career: the four-seamer, curveball and cutter. Though Hughes has offered a changeup periodically throughout the years, it’s never been a successful pitch by any metric. PITCHf/x also has Hughes as having thrown a number of sliders in 2008 and 2009, although the Yankees rather famously asked Hughes to scrap his slider (ready for more weeping? Per the aforelinked Axisa piece, “Hughes’ slider reportedly puts his other pitches to shame; it’s a power pitch that breaks hard and late and induces plenty of swings and misses, however the Yankees made Hughes keep it in his pocket in an attempt to develop his other pitches”), and while he’s shown flashes of some sort of slider here and there — this 2008 piece from The Hardball Times refers to it as more of a “slurve,” while it most recently turned up again this past spring, as something of a cutter-slider hybrid — there’s not enough of a sample to do any meaningful analysis.

A handful of two-seamers also showed up during my research, though I’m not sure it’s accurate to say “Phil Hughes has a two-seamer,” given that people with far more advanced understanding of PITCHf/x than I have noted that technically there doesn’t appear to be a tremendous difference between his four- and two-seam fastballs, not to mention the fact that if he does have one, he hasn’t thrown it with any consistency since last season (according to PITCHf/x he only threw one two-seamer this year).

Additionally, given what we know about the limitations of PITCHf/x, there are likely some classification issues as it is, but I can only go on the data we have available to us.

Four-Seamer

The following table (all data in this post courtesy of TexasLeaguers.com) shows the evolution of Hughes’ four-seam fastball over the 11 delineated periods. The light blue highlights denote Hughes’ relief stints, while the yellow highlights signal when Hughes was better than league average in a given category.

Hughes’ four-seamer has always been his best pitch, but as we saw back in April when the velocity’s not there he may as well be throwing batting practice. The most effective it’s ever been as a starter — and this is certainly open to debate — is during his lost second half of 2010. During that time his four-seamer was averaging 93mph, he recorded a career-high (as a starter) 9.6% Whiff%, got hitters to foul it off 25% of the time (down from 30% during his superior first half) and put it in play less than 18% of the time, marking the last time he was below league-average in the latter category as a starter.

Though he was still missing one mph off his heater in the second half of 2011, the pitch was actually still pretty good, netting a slightly above-average Whiff% and ultimately clocking in at a fairly robust 0.57 wFB/C, which would have made it one of the most effective in the AL had he enough innings to qualify.

Curveball

The only breaking pitch presently in Hughes’ arsenal is his curveball, which again, at varying points in his career, was expected to be a major weapon. For even more weeping, here’s a Baseball America quote circa 2006 from a piece by our own Joe Pawlikowski written in August of last year (emphasis mine):

“Hughes’ greatest accomplishment as a pro has been to forsake his slider in favor of a knockout curveball, which is more of a strikeout pitch and produces less stress on his arm. It’s a true power breaking ball that sits in the low 80s with 1-to-7 break. Club officials call it the best in the system because Hughes can throw it for quality strikes or bury it out of the zone, and because he uses the same arm slot and release point he uses for his fastball.”

Sob sob sob. I’m pretty sure none of those superlatives accurately describe Hughes’ present-day curveball.

Since becoming a full-time starter at the outset of the 2010 season, he’s never thrown it for strikes at above a league-average rate. Though this may partially be by design, it also hadn’t generated an above-average percentage of swings until this past season. It’s also never been an above-average swing-and-miss pitch for any significant stretch of time as a starting pitcher, which is a major problem when you’re a Major League pitcher in need of a good breaking ball.

That said, second-half-2011 Hughes did seem to show some promise with what appeared to be yet another variation on his curveball. The pitch still has a ways to go, but he appeared to be getting a good deal more comfortable in deploying the curve when getting ahead of hitters with two strikes.

Cutter

And here’s a look at Hughes’ cutter:

Hughes didn’t start throwing the cutter until 2009 and had great success with it in relief that season. The pitched peaked for Hughes as a starter in 2010, and then seemingly out of nowhere the cutter became useless in 2011. This development may have been the most baffling of all for Hughes during this past season. While much of the cutter’s decline can likely be tied to his overall decrease in velocity, I’m not sure I’ve seen an explanation as to why he was able to regain roughly three of the missing four mph on his four-seamer, while only two of the missing four mph on his cutter came back. As such, Hughes was ostensibly a two-pitch pitcher during the second-half of 2011, although in one sense that makes his relative success — though Hughes posted a 4.55 ERA over 11 second-half starts, he actually pitched pretty well if you take away his two random disaster outings against Oakland, with an ERA of 3.13 over 54 2/3 innings — perhaps a bit more heartening.

Conclusion

Phil Hughes clearly still has plenty of work to do if he has any hopes of representing a top-of-the-rotation solution for the Yankees — or any team in MLB for that matter — although I do think some of the data we’ve looked at today provides a glimmer of hope. I’m definitely curious to see what a Phil Hughes who’s hopefully back at 92-93mph with his fastball can do with a still-developing-but-hopefully-finally-usable curveball, and the most important piece of the development puzzle for Hughes is that expectations have been lowered dramatically — think Ivan Nova heading into last season.

At this point no one’s expecting anything better than a #4, and probably more like a #5 starter-type performance out of Hughes, but I think he could surprise a lot of people next season. Another reason I’m somewhat bullish on Hughes for next year is that though his rate stats were basically uniformly down in 2011, if you look at the daily graphs his numbers were almost universally trending in the right direction across nearly all 10 categories following his return to the rotation in early July. It may not be much, but it’s a start.

The tools and ability are there, which should enable him to exceed even the lowest expectations, but it’ll require an enhanced focus, commitment to his craft and also a professional to help him harness his natural talent. I realize that all sounds like a bunch of intangible crap, particularly after spending an entire post focused on the numbers, but I can only encourage #65 to “throw harder” and “develop a non-fastball out pitch so that you don’t lead the world in foul balls,” so many times before I go hoarse. He knows he needs to do these things, and it’s incumbent upon him to effect the changes that can turn his career around. If I’m Phil Hughes I would not only be intent on completely rededicating myself this winter, but I’d also be banging down Larry Rothschild’s door for as many one-on-one tutorials as possible, as 2012 may represent the last opportunity the soon-to-be 26-year-old will have to show he can hack it as a front-line starter in the Majors.

Filed Under: Analysis Tagged With: Phil Hughes

  • « Previous Page
  • 1
  • …
  • 7
  • 8
  • 9

RAB Thoughts on Patreon

Mike is running weekly thoughts-style posts at our "RAB Thoughts" Patreon. $3 per month gets you weekly Yankees analysis. Become a Patron!

Got A Question For The Mailbag?

Email us at RABmailbag (at) gmail (dot) com. The mailbag is posted Friday mornings.

RAB Features

  • 2019 Season Preview series
  • 2019 Top 30 Prospects
  • 'What If' series with OOTP
  • Yankees depth chart

Search RAB

Copyright © 2025 · River Avenue Blues